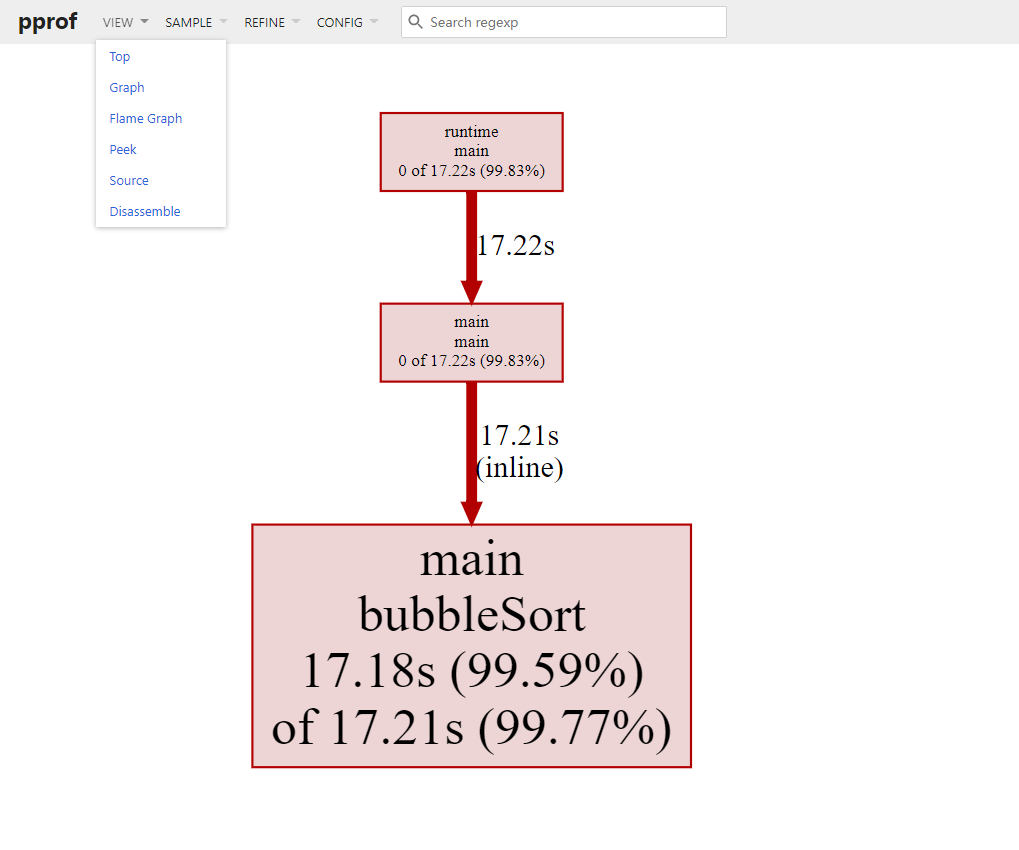
[root@VM-16-2-centos pprof-test]# go tool pprof cpu.pprof File: main Type: cpu Time: Jul 31, 2022 at 3:58pm (CST) Duration: 17.34s, Total samples = 17.25s (99.46%) Entering interactive mode (type"help"for commands, "o"for options) (pprof) top Showing nodes accounting for 17.18s, 99.59% of 17.25s total Dropped 17 nodes (cum <= 0.09s) flat flat% sum% cum cum% 17.18s 99.59% 99.59% 17.21s 99.77% main.bubbleSort (inline) 0 0% 99.59% 17.22s 99.83% main.main 0 0% 99.59% 17.22s 99.83% runtime.main (pprof) top -cum Showing nodes accounting for 17.18s, 99.59% of 17.25s total Dropped 17 nodes (cum <= 0.09s) flat flat% sum% cum cum% 0 0% 0% 17.22s 99.83% main.main 0 0% 0% 17.22s 99.83% runtime.main 17.18s 99.59% 99.59% 17.21s 99.77% main.bubbleSort (inline) (pprof) help Commands: callgrind Outputs a graphin callgrind format comments Output all profile comments disasm Output assembly listings annotated with samples dot Outputs a graphin DOT format eog Visualize graph through eog evince Visualize graph through evince gif Outputs a graph image in GIF format gv Visualize graph through gv kcachegrind Visualize reportin KCachegrind list Output annotated source for functions matching regexp pdf Outputs a graphin PDF format peek Output callers/callees of functions matching regexp png Outputs a graph image in PNG format proto Outputs the profile in compressed protobuf format ps Outputs a graphin PS format raw Outputs a text representation of the raw profile svg Outputs a graphin SVG format tags Outputs all tags in the profile text Outputs top entries in text form top Outputs top entries in text form topproto Outputs top entries in compressed protobuf format traces Outputs all profile samples in text form tree Outputs a text rendering of call graph web Visualize graph through web browser weblist Display annotated source in a web browser o/options List options and their current values q/quit/exit/^DExit pprof